Whose Getting Covid-19 Fatigue?
There are a few ways to interpret the data we have amassed under the web application in Chicano Press. Today, we try to compare the aggregate infection counts to prior months. We hope to infer whose in some sense improving relative to where they were the month before. I’m sure there is a more sophisticated way to do this analysis.
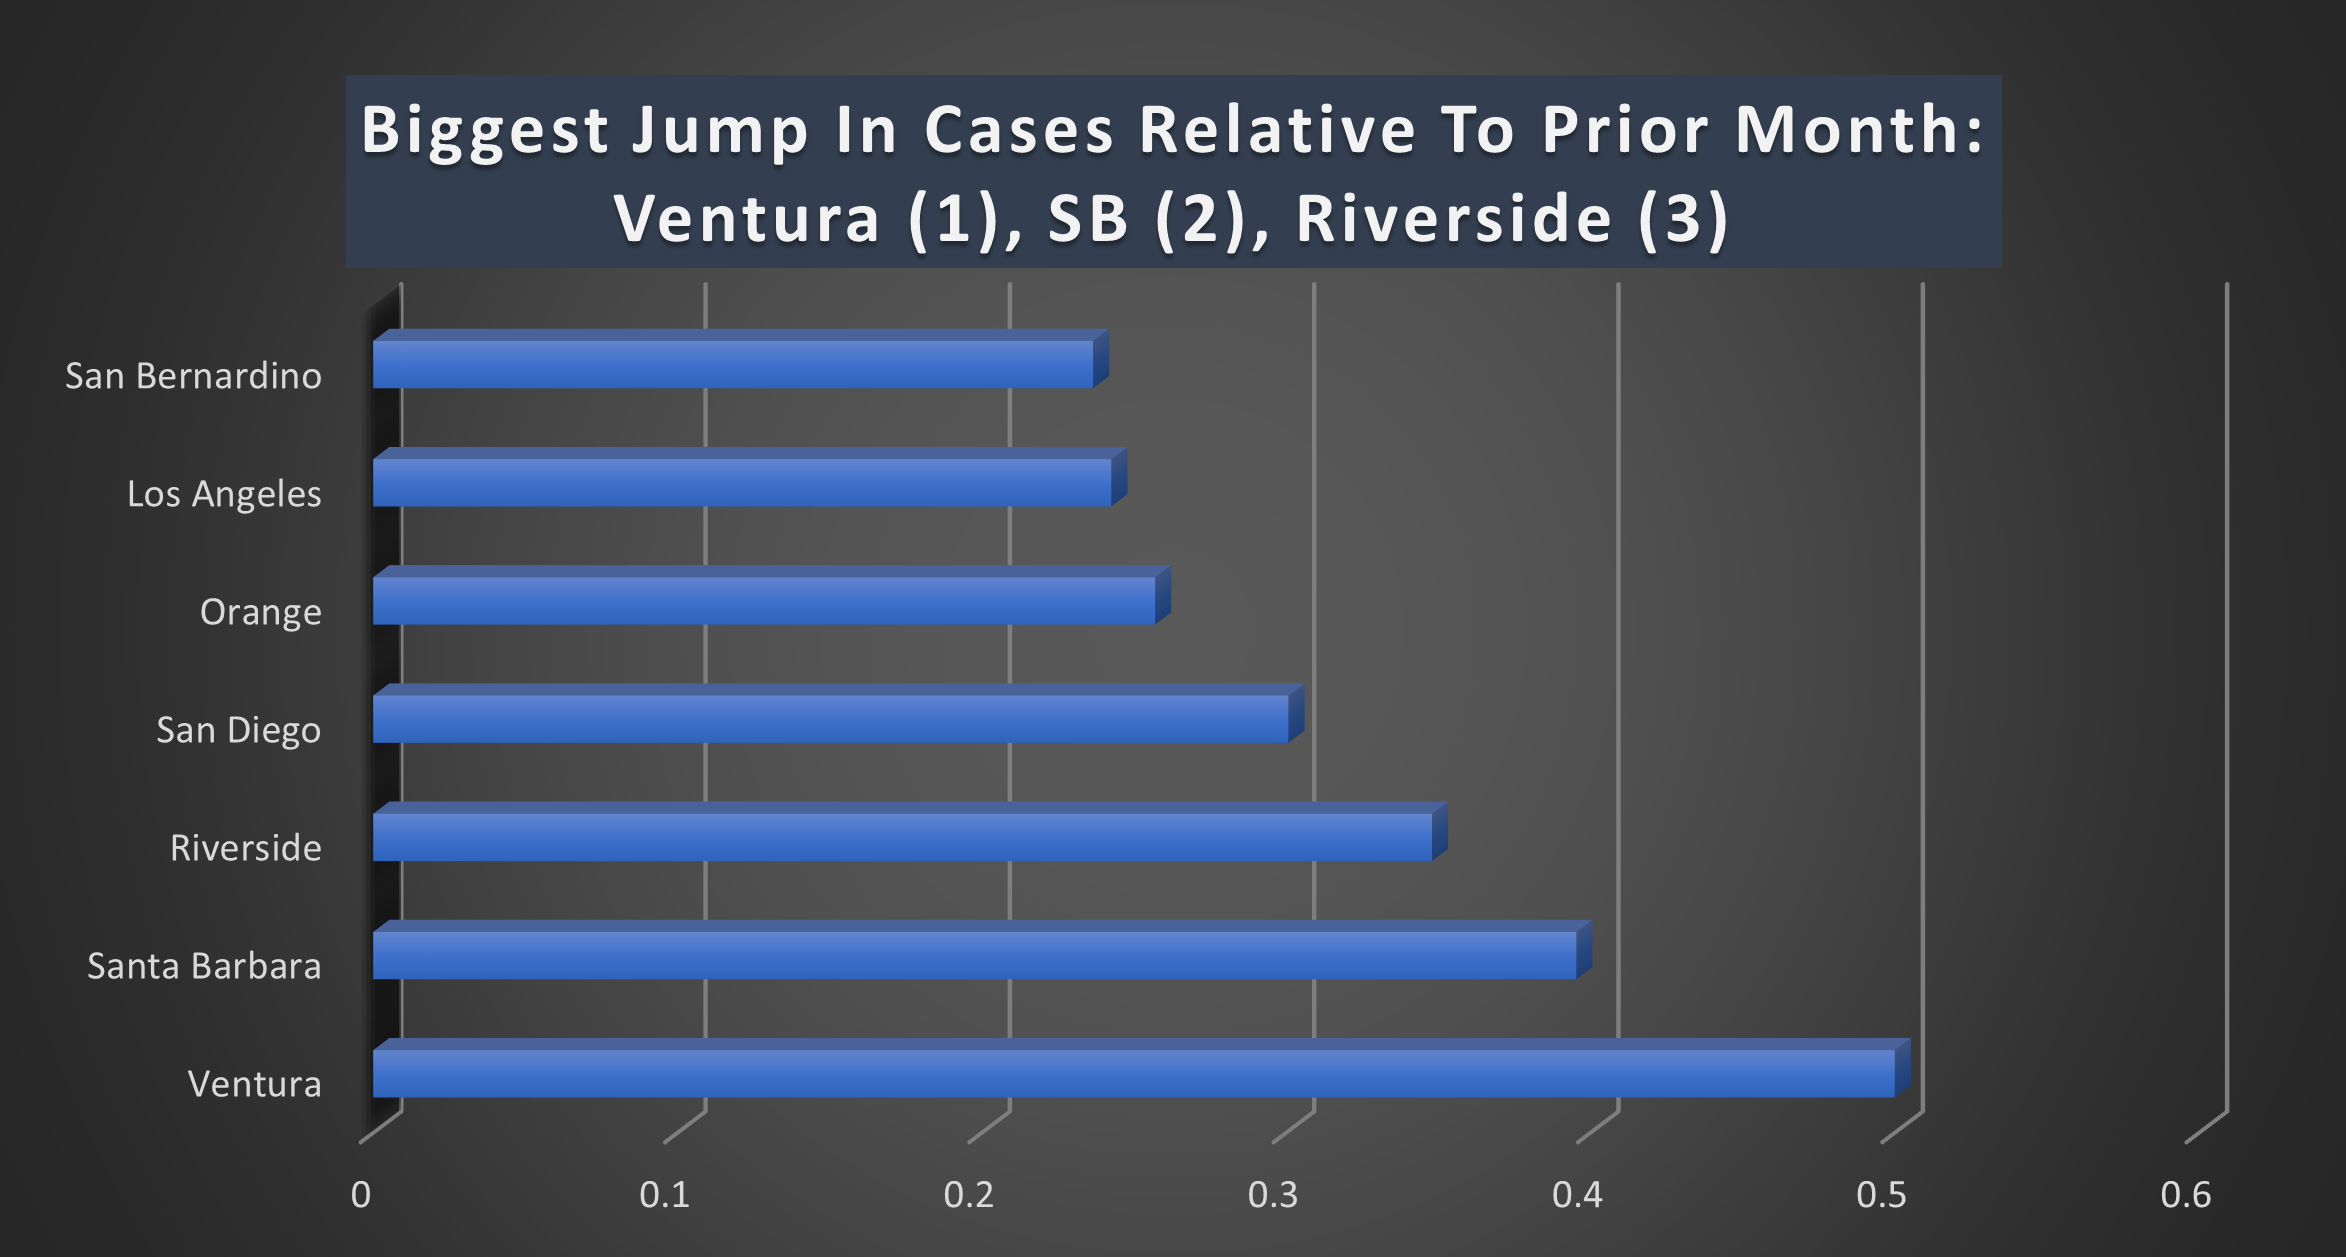
For now, here’s whose generating the most Covid-19 infections based on that logic:

| County | 1/10/2021 | 2/6/2021 | Rate of Change |
| Ventura | 48,317 | 72,479 | 0.500072438 |
| Santa Barbara | 21,323 | 29,755 | 0.395441542 |
| Riverside | 207,841 | 280,170 | 0.348001597 |
| San Diego | 188,600 | 245,334 | 0.300816543 |
| Orange | 188,602 | 237,077 | 0.257022725 |
| Los Angeles | 920,177 | 1,143,422 | 0.242610932 |
| San Bernardino | 224,350 | 277,430 | 0.236594607 |
| Imperial | 23,472 | 26,372 | 0.123551466 |